
Real-time vibrations monitoring (SPPV) and automatic alert notification
1. Vibrations Monitoring
The purpose of this system is to record vibrations in buildings being caused by human activity or construction works, for
Thresholds for each sensor can be set separately. If the threshold level is exceeded by the amplitude of the oscillation caused by the nearby activities, alert messages are generated and sent until the velocity level falls back below the activation limit.
2. Instruments
The recording system consists of the following parts: three-axis velocity sensor, seismic digitizer, central
2.1 Seismic Sensors
Modified C100 type, 3 channel velocity seismic sensors, can be used (Fig 1 and 2). The sensor ranges from 0.005 mm/sec to 100 mm/
2.2 Seismic Digitizer
The digitizer of the application (Figures 3 and 4) is the SRi32S datalogger unit, which includes a three seismic channels digitizer unit and a local recorder, and supports real-time data transmission over the
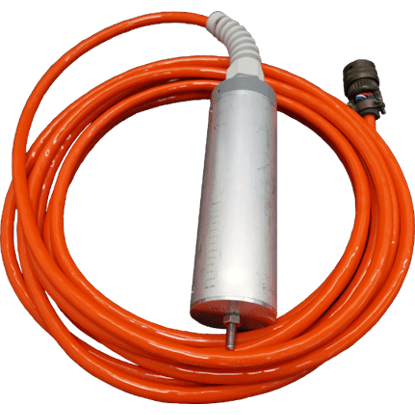
Figure 1
C100 borehole sensor
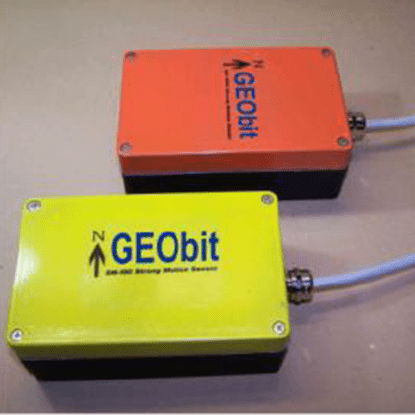
Figure 2
C100 surface sensor
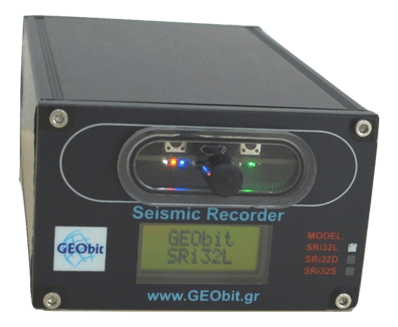
Figure 3: SRi32S Digitizer/Recorder
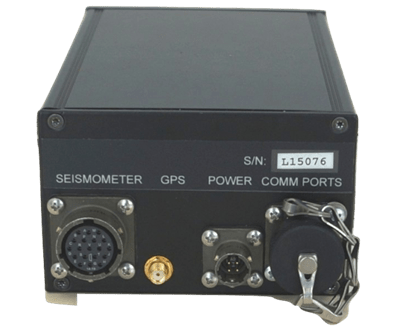
Figure 4: SRi32S Digitizer/Recorder back view
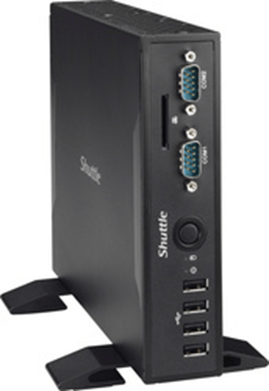
Figure 5: Central recording PC
2.3 Central Recording System
The central recording system (Figure 5) consists of a small
3. Installation
The borehole type sensors can be settled into a shallow hole (small post hole) in the ground. The surface type sensors can be mounted using quick dry cement. The cables must me passed through

Figure 6: Surface type sensors

Figure 7: Borehole type sensors

Figure 8: Installation in progress

Figure 9: Monitoring system shelter
4. Automatic real-time ground vibration velocity calculation (SPPV) – Software (GEOShock)
The communication and analysis software (GEOShock) is running on a
The implementation of the software has been developed in such a way that it provides continuous monitoring and recording of the vibrations in real time, calculating in parallel for every minute, how many times the SPPV limit has been exceeded (if so). The SPPV limit is not constant but linear to the frequency from 10 to 100Hz and can be derived from the structural study of the building.
The software has the ability to send automated email notifications to the user in case of a limit is exceeded.

Figure 10: Real-time velocity waveforms from the six sensors (18 channels)
The SPPV velocity calculation is automatically performed from the monitor service program GEOshock that processes the data in real time, calculates the SPPV magnitude and displays it in a plot as a function of frequency. It also plots the maximum SPPV value calculated for every minute. If the SPPV threshold is exceeded, the user receives an alert e-mail containing the maximum value that

Figure 11: SPPV vs frequency