
Noise level measurement for geothermal monitoring seismic network
1. Introduction
This project aims at a) the characterization of the ground noise at the geothermal site and b) the investigation if a sufficient signal to noise ratio can be achieved by installing seismic instrument at
2. Equipment
The equipment used for this test was
- C100 seismic sensor
- SRI32L seismic digitizer-recorder with integrated sensor electronics
- 12V battery
- GPS antenna, power cable
The sensor was placed into the water well at depths of 30, 60, 86 meters.

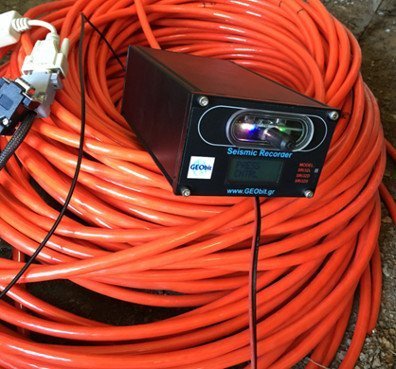
Picture 1
S100 sensor with 125 m cable
3. Equipment modifications
C100 sensor’s cable had to be extended to 125m from the standard length of 20m. A very special lightweight cable, with excellent shielding, pressure resistance with breaking tense 350kg was selected to support the sensor.
A sensor adapter was necessary to be constructed by GEObit to ensure excellent coupling between the sensor and the casing of the test well.
Picture 2
The SRi32L recorder in operation

Pictures 3, 4, 5: S100 sensor adapter


4. Installation
The sensor installation was done with the usage of a pushing stick. We used strong (16atm) plastic 3/4inch pipe pieces of 2.5m length, able to be connected with metallic clutches link. Additionally, special care was taken for driving the sensor’s cable and the packer’s wire while we rigged the sensor down.
Once the sensor with its adapter was placed at the desired depth, the PVC stick was pulled up for five meters ensuring no more contact with the adapter.
The digitizer and the battery were placed at the nearby old small shelter. The GPS antenna was placed outside of the small shelter.

Pictures 6, 7, 8
S100 sensor insertion into the borehole


5. Recording scheme & parameters
The sampling rate of the recorder was set to 200sps. Since the main known noise source is the nearby road, we oriented the sensor in relation
6. Testing the installation
We used the
We made also some weight drop tests with a standard weight (6kg) at fixed positions (30m, 60m, 150m), dropped from a fixed height (2m) from the ground to check the amplitude of the recording signal versus depth.

Pictures 9, 10
S100 sensor & recorder inspection at site

7. Data retrieval & Data Analysis
The data of the SRi32L recorder unit are stored into the removable microSD flash card. A quick view of the noise can be done using the “Helicorder” software, which plots 24h data on the screen.
7.1. Noise plot at 30m

Picture 11
Signal plot at 30m, daytime

Picture 12
Signal plot at 30m, nighttime
7.2. Noise plot at 60m

Picture 13
Signal plot at 60m, daytime

Picture 14
Signal plot at 60m, nighttime
7.3. Noise plot at 86m

Picture 15
Signal plot at 86m, daytime

Picture 16
Signal plot at 86m, nighttime
7.4. Noise plot comparisons
Pictures 17, 18, 19
Signal plot at daytime, 30m, 60m, 86m
Pictures 20, 21, 22
Signal plot at nighttime, 30m, 60m, 86m
8. Simulation of the weight-drop test as a micro-earthquake
8.1. Empirical method
Using the DataViewer tool and the ability to calculate the magnitude and the distance of a recorded earthquake (based on an empirical formula), we simulated the weight drop signal with a real seismic signal. The simulation shows that it represents an earthquake magnitude -1.12R occurred at distance 1km from the sensor.
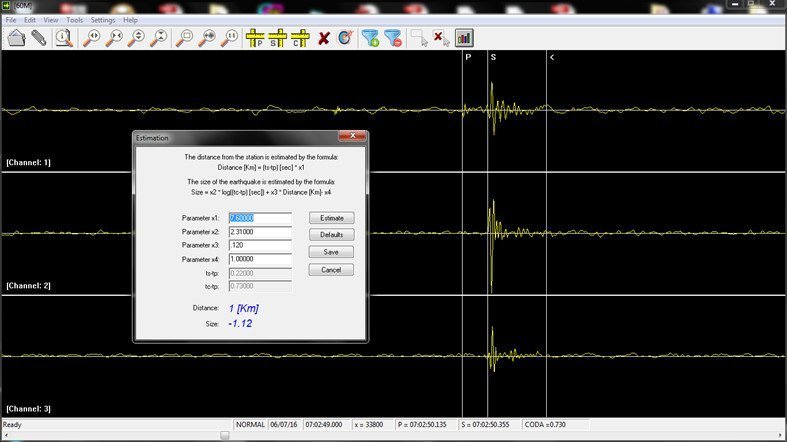
Picture 23
Weight drop at 60m from the well’s head when sensor depth is 86m – seismic event simulation
8.2. Magnitude calculation based on Hypoinverse formula
This analysis was based on the Earthquake Magnitude calculation formula (eq.1) used by Hypoinverse software. The signal amplitude (Wood Anderson trace) is denoted as Awa, while F1 and F2 are derived using specific formulas in Hypoinverse.
ML = log(Awa/2)+F1(s)+F2(d)
For using this formula,

Picture 24
Minimum amplitude pick from the Wood-Anderson seismogram

Picture 25
Maximum amplitude pick from the Wood-Anderson seismogram
We analyzed a weight drop signal that occurred 60m from the surface of the well, the relative position of the weight drop and the recorder gives the following formula. Awa was measured as 0.13mm. as Awa, while F1 and F2 are derived using specific formulas in Hypoinverse.
ML = log(0.13/2)-0.047+0.088 = 1.18
The result is similar to the empirical one. So it is proven that the station is able to record events with magnitude less than -1R even with the presence of noise created from the local road when the sensor is placed at 86m.
9. References
- DataViewer software tool –
GEObit - Helicorder software tool –
GEObit - PQL II program for viewing seismic data –
Passcal - Seisgram2k – Anthony Lomax
- Hypoinverse manual – USGS