
Horizontal to Vertical Spectral Ratio (HVSR) using the Nakamura measurement method
1. Introduction
Nakamura’s technique has gained popularity over the past years because it is an inexpensive method and can be applied to regions of low seismicity. Also, it requires only one single seismic station. There is a disagreement among various researchers on the nature of the microtremor as there is no established theory concerning the kind of wave motions the microtremor survey provides (Bard, 1999).
Although the specific mechanism causing wave amplification can vary from site to site, several studies suggest that ambient noise of weak motions, can be used to identify areas that might amplify earthquake of occurrence (Nakamura 1989, 1997).
2. Equipment
The GEObit instruments GEOtiny compact digital seismometer was used to acquire the data of the H/V survey. The GEOtiny supports 10s-98Hz velocity seismic sensor.
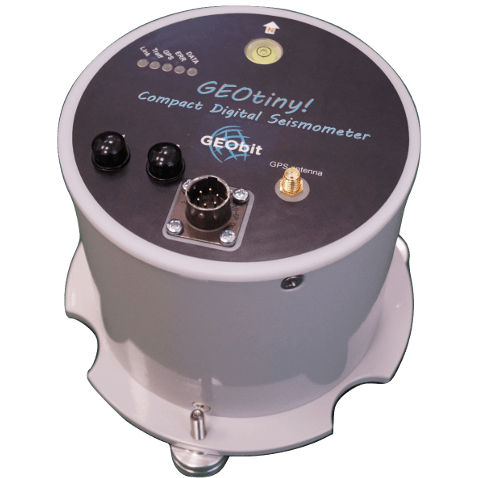
Figure 1: The GEOtiny compact digital seismometer
3. Data Processing
For the data processing, we used the Geopsy analysis software which is a freeware software.
a. Description of the H/V method
The technique originally proposed by Nogoshi and Igarashi (1971), and wide-spread by Nakamura (1989), consists in estimating the ratio between the Fourier amplitude spectra of the horizontal (H) to vertical (V) components of the ambient noise vibrations recorded at one single station.
The computation of the H/V ratio follows different steps:
- record a 3-component ambient noise signal
- select of the most stationary time windows (e.g., using an anti-triggering algorithm) in order to avoid transient noise
- compute and smoothing of the Fourier amplitude spectra for each time windows
- Average the two horizontal components (using a quadratic mean)
- compute the H/V ratio for each window
- compute the average H/V ratio
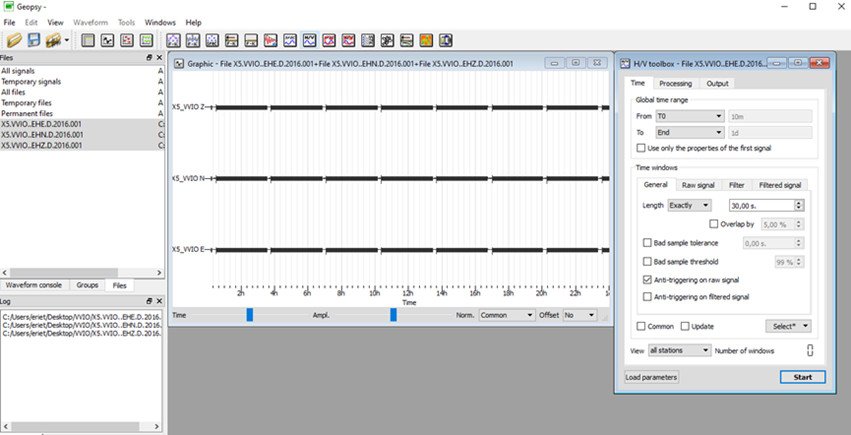
Figure 2: The Geopsy SW.
b. Example for HVSR
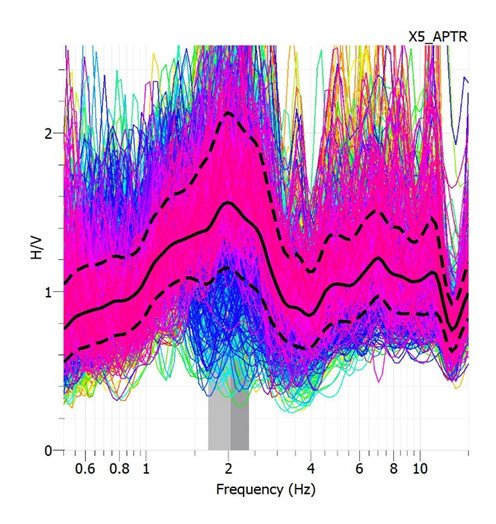
Figure 3: H/V ratio
c. Example for Azimuths
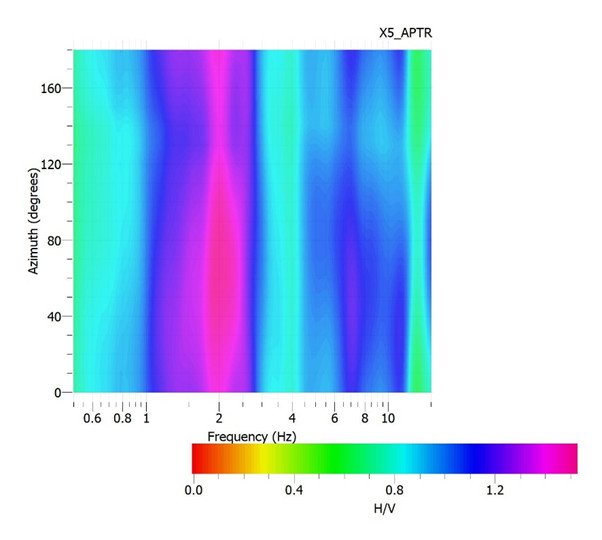
Figure 4: Azimuths
Because the results from Geopsy are not sufficient to fully explain the data, we use Matlab to complete our research. This is achieved by using scripts that we have commanded to view our final charts depending on how many days and hours the recording is.
d. Examples of Plots using scripts
I. H/V-Frequency, this is the same as the chart from geopsy and this way we can verify the results.
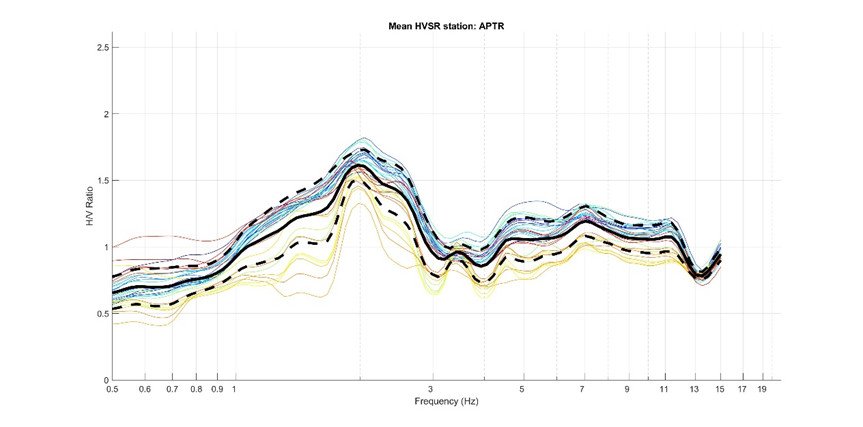
Figure 5: H/V frequency
II. F0(Hz)-Day of the year & Amplitude – Day of the year. The final results are performed with these two diagrams using SESAMES table Criteria for the reliability of results.
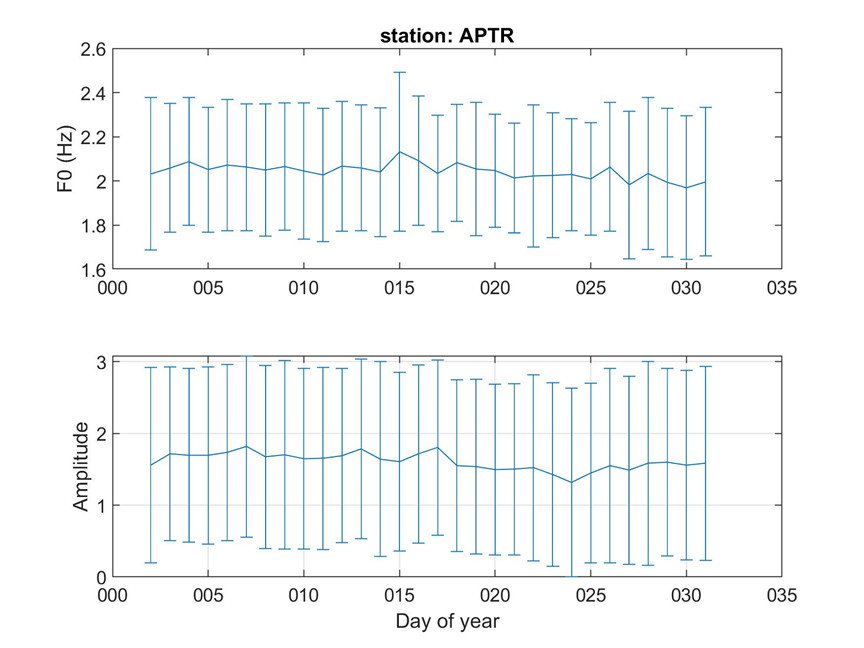
Figure 6: F0 (Hz) & Amplitude per day
e. Criteria for reliability of results (SESAME)
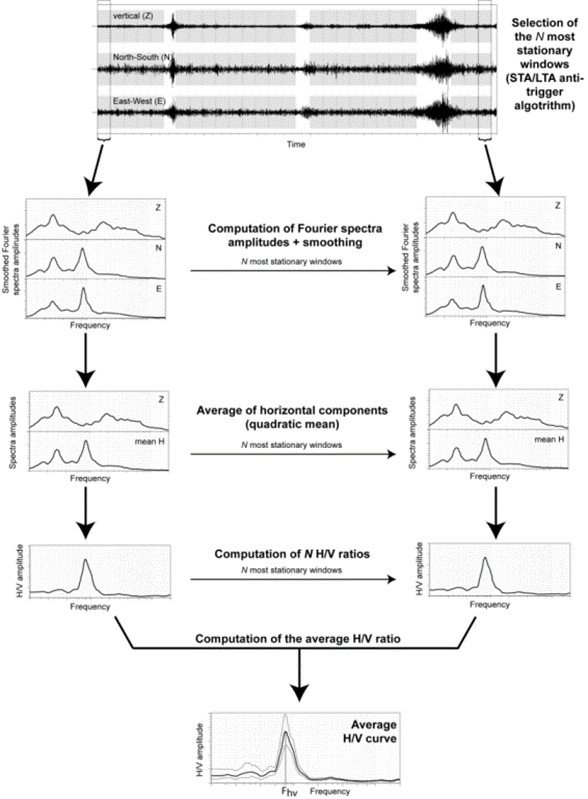
Figure 7: Reliability control
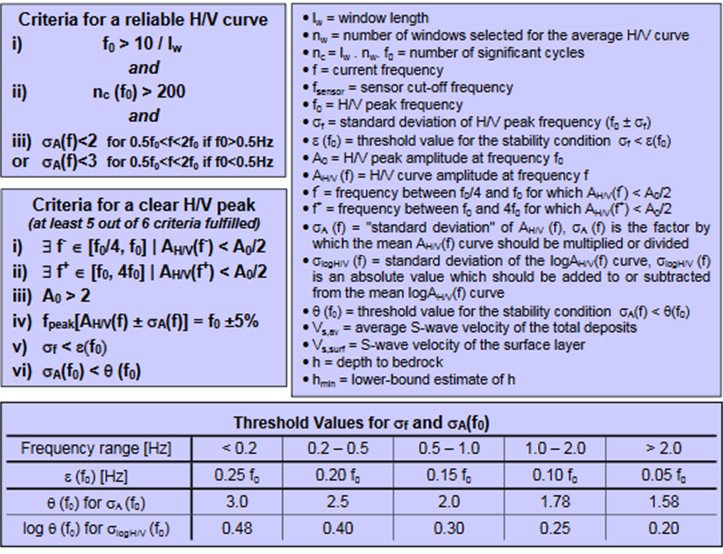
Figure 8: Criteria for a reliable H/V curve (after SESAME, D23.12, Guidelines for implementation of the H/V spectral ratio technique on ambient vibrations)